These empirical relationships have been developed to generate the line defining the infinite-life design region. These relationships generate curves that connect the endurance limit on the alternating stress axis to either the yield strength, ultimate strength, or true fracture stress, on the mean stress axis.
Test data tends to fall between the Goodman and Gerber lines.
For hard steels, the ultimate strength approaches the true fracture stress, therefore Goodman and Morrow equations will produce similar results. For ductile steels, the Morrow equation is less sensitive to mean stress.
For cases where the mean stress is small in relation to the alternating stress, there is minimal difference between the results produced by the equations. When R approaches 1 (see here), the yield criterion may set the design limits.
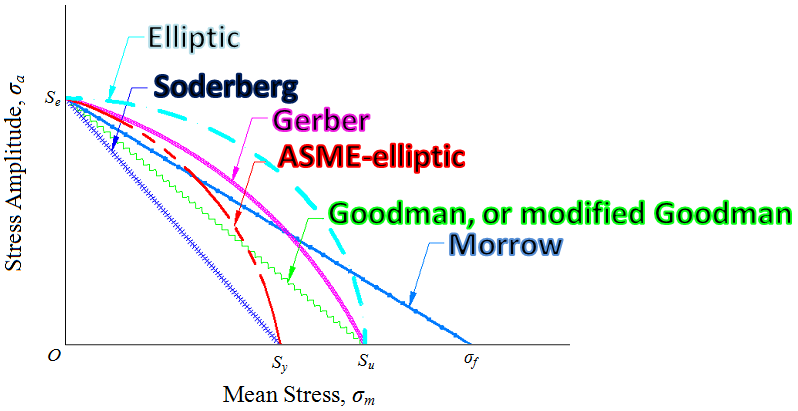
The following figure is a fatigue diagram showing various criteria of failure. For each criterion, points on or "above" the respective line indicate failure. A random point on one of the lines will give a strength Sm as the limiting value of σm corrresponding to the strength Sa, which, paired with σm, is the limiting value of σa.
The following generalizations can be made when discussing cases of tensile mean stress:
− The Soderberg method is very conservative and seldom used.
− Actual test data tend to fall between the Goodman and Gerber curves.
− For hard steels (i.e., brittle), where the ultimate strength approaches the true fracture stress, the Morrow and Goodman lines are essentially the same. For ductile steels (σf > Su) the Morrow line predicts less sensitivity to mean stress.
− For most fatigue design situations, R < 1 (i.e., small mean stress in relation to alternating stress), there is little difference in the theories.
− In the range where the theories show a large difference (i.e., R values approaching 1), there is little experimental data. In this region the yield criterion may set design limits.
For finite-life calculations the endurance limit in any of the equations can be replaced with a fully reversed alternating stress level corresponding to that finite-life value.
Related ▪ L - Cyclic Loading
▪ L - Modified Goodman Diagram