Stress-life can be abbreviated by S-N. The stress-life method may result in valid data for design applications where the applied stress is primarily within the elastic range of the material and the resultant lives (cycles to failure) are long, such as power transmission shafts. The stress-life method does not work well in low-cycle applications, where the applied strains have a significant plastic component. In this range a strain-life approach is more appropriate. The dividing line between low- and high-cycle fatigue depends on the material under consideration, but usually falls between 10 and 105 cycles.
The basis of the Wohler or S-N diagram, which is a plot of alternating stress, S, versus cycles to failure, N.
One of the major drawbacks of the stress-life approach is that it ignores true stress-strain behavior and treats all strains as elastic. This may be significant since the initiation of fatigue cracks is caused by plastic deformation. The simplifying assumptions of the S-N approach are valid only if the plastic strains are small. At long lives most steels have only a small component of cyclic strain which is plastic (in some cases it is effectively too small to measure) and the S-N approach is valid.
S-N test data are usually presented on a log-log plot, with the actual S-N line representing the mean of the data.
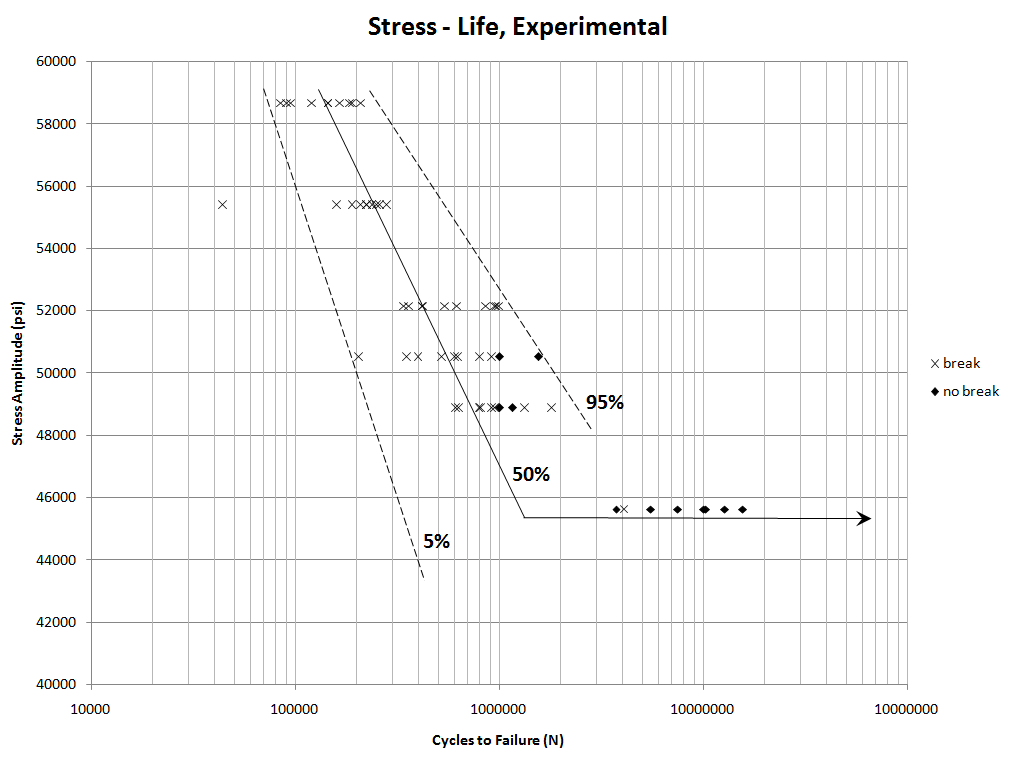
A stress-life curve may be used to approximate life for different amplitude stresses, where the y-axis is stress and the x-axis is life (in number of cycles).
Related
▪ L - Power Equation for Stress-Life
▪ L - Endurance Limit and Ultimate Strength