Understanding a Log-Log Graph


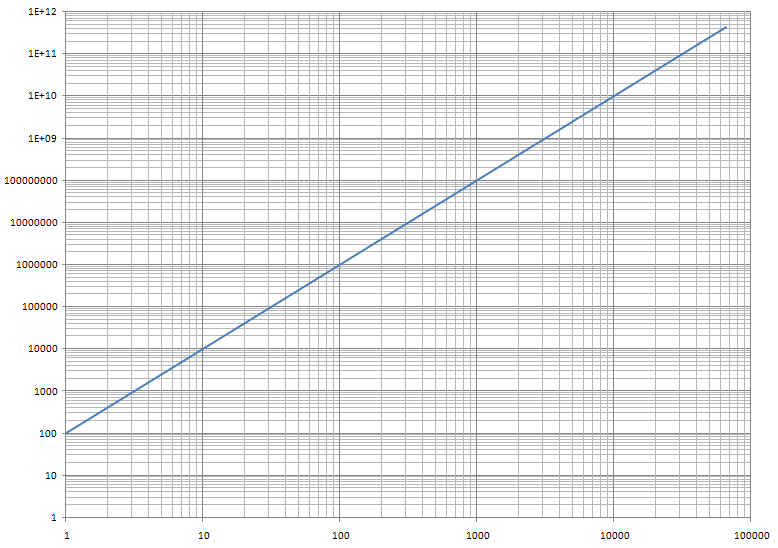
To the right is a log-log plot of the power function:

 y = 100x2

Power functions appear as straight lines and linear functions appear as curved lines on a log-log graph.

If this function is plotted into the calculator, the result will be a parabola (if the graph is using a regular scale).

A power function is of the form:

 y = axb

Typically, a is referred to as the y-intercept (where the function intersects the y-axis when x = 0). The power b is referred to as the slope.

Usually, when y-intercept and slope are thought of, it is with respect to the linear function:

 y = mx + b

Where m is the slope and b is the  y-intercept.


Notice how the plot is divided evenly into "blocks" by powers of ten:


This can also be referred to as 1-cycle by 1-cycle, as a cycle is an increment separated by a power of ten. For example 10 to 100 is one cycle, as well as 10000 to 100000, and 1 to 10.

Going back to the equation above, 2 is the slope. Also notice that on the plot, for every 1 cycle it spans right, it spans 2 cycles upward.


This agrees with slope = rise/run.

If the slope b = 1, then for every cycle the function spans right, it will span 1 cycle upward. If the slope b = -0.5, then for every 2 cycles the function spans right, it will span 1 cycle downward (rise/run = -1/2 = -0.5).